Measuring Latency with Apache Bench

One of the important factors in the speed of your site is the distance between your servers and the browser visiting your site. The time it takes the information to travel from the server to the browser is called latency. Latency increases with distance, so no matter how fast your servers may be, high latency can make your site load slowly for visitors who are geographically removed from your servers.
Since there are plenty of places to measure your site speed online, this article goes into detail of how to measure your site latency using Apache Bench. This is helpful because you’ll know how to make educated hosting decisions, AND after running the following test, you’ll be familiar with Apache Bench, a useful tool for site administration.
Less latency = faster websites?
The question of latency came up when WP Engine, a managed WordPress hosting provider, and the company I work for, began fielding support calls from Asian and Pacific geographies. They had a variety of questions about our hosting, but we answered the same question about latency several times:
“How much faster would my site be to me if I moved it to another location?”
We decided that it would be helpful to share a tutorial of how to answer this question for those so inclined.
This question often came from an Asian country who was asking if their site would load faster on their continent if they moved their hosting from North American servers to Asian servers. The distance between the browser and the server are an important factor in how quickly a page will load in a browser. It will simply take longer for a page to load in China if it is being served from Dallas, Texas instead of Beijing.
It’s fair to say that most, if not all, big WordPress sites have visitors from across the globe, so it can be useful to know how to test the relative speed differences between hosting companies or locations, so we’ll show you how to use Apache Bench to do that.
Defining terms
First off, lets define terms. We’re measuring latency rather than total speed. That is, we’re concerned with the time it takes the first byte to appear in the browser, not the time it takes all the bytes to appear.
That’s because distance typically increases latency but not throughput.
For example, suppose a browser in London is hitting a server in New York City. First it has to make the request for the page — traversing the Atlantic or bouncing off a satellite — then the server starts sending the response, which now also has to move across the Atlantic.
Let’s call the length of time to move across the ocean L (for Latency) and the length of time the server takes to start sending bytes S (for Server-Speed). Then the time of this transaction is:
2L + SActually, in reality it’s worse than that. That’s just the HTTP request, and before that even happens you have to establish the TCP/IP connection, which takes another back-and-forth (actually there’s three legs to that protocol, but we’ll gloss over that detail), so the true equation is:
4L + SIf the browser is in New York City, L will be small, perhaps as little as 40ms. Whereas even on very fast servers like we have at WP Engine S is at least 250ms, and typical hosting providers with page-cache plugins have 500ms of S. Without page caching S could be up to 1-4 seconds. Therefore, when you’re close to the server, S dominates the equation, and the speed of the server is the most important factor.
However, with a browser request from London, L is easily 500-750ms. With a fast server the latency is an order of magnitude more time than the server time. At great distances, the latency will completely determine the apparent speed of your website.
Measuring Latency with Apache Bench
So how do you easy measure latency in the field? And in particular, how would we measure the difference between identical servers in London and NYC?
There’s a simple, free tool from Apache called Apache Bench, which we recommend for basic tests like these (and many other too). You can run Apache Bench from Terminal on a Mac, or Putty on Windows. There are other options depending on how secure you want to be.
To make sure it’s working for you, let’s see what happens when you run it once on our company homepage:
ab http://wpengine.com/
(Note the trailing slash — ab is finicky about that!)
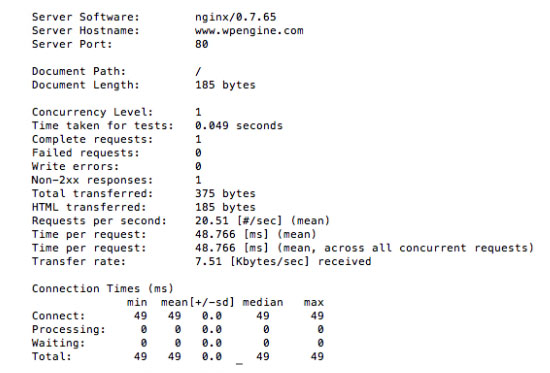
A successful test will look like this:
 Apache Bench Test 1
Now the trouble with making just one request is that there’s all kinds of errors that can happen. For example, maybe someone two houses down just started downloading 17 simultaneous bittorrents of porn. That will mess up your results.
So what we really need is to run N trials and aggregate the results. ab can do that. Suppose N is 100, and just do this:
ab -n 100 http://wpengine.com/
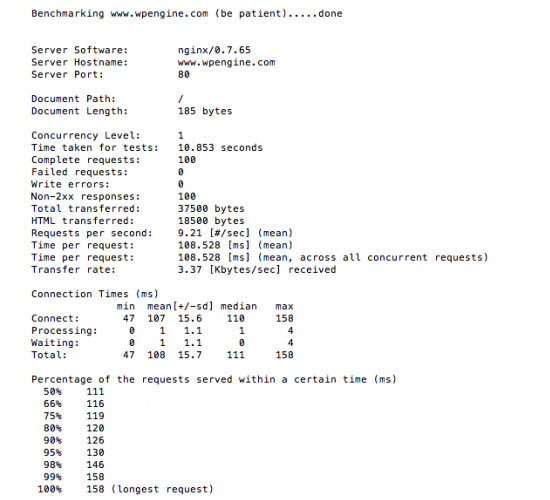
Now the results are more interesting, showing us average and standard deviation, as shown in this sccreenshot:
 Apache Bench Test 2
The “standard deviation” tells you how much error is there. Assuming a normal distribution of results (which seems appropriate), 95% of the results fall within +/- 2 standard deviations. Even if the distribution is not normal, at least 75% of the results fall within +/- 2.
In particular, check out the “time to connect” and “time to start,” which show the 2L time to establish the TCP/IP connection and the additional 2L + S time to request the page and start getting the data.
In fact, just from these two data points we can compute L and S! After all, we have the following:
(1)   2L = A
(2)   2L + S = B
So subtracting (1) from (2) we find that B – A = S, and A/2 = L. Now, this is just an estimate because, remember, there’s lots of potential error and variation here. Still, it’s a good bit of data to gather.
Now of course we only have to run the same command from a machine in another location to find the difference in L.
So to solve the original problem, the person in London can run Apache Bench against a copy of her blog in London and the live one in New York City to measure the difference.
This is a helpful method to check your site’s latency in various geographic locations. Just because it’s blazing fast in the US, does not mean that your customer in Europe or Asia will be getting served as quickly, especially if the closest server is far away.
Let us know what you think! How else are you guys using Apache Bench, or how has measuring this latency changed the way you’re managing your WordPress?
Special guest post by Austin Gunter
5 responses
-
having a bit of trouble reading ab’s output. which field is showing me: standard deviation, average and what figures do I input into:
(1) 2L = A
(2) 2L + S = BOtherwise a great article, thanks.
-
Im confused like Ovidiu. I don’t see the time to connect and time to start values in the output. It’s a great article, and I really want to try this, but just need this clarification. Thanks
-
Hey Guys,
Thanks for the clarifying question.
Look at the fields under “Connection Times (ms)” for L and S.
The “Connect” line is the time to connect, or the Latency (L). “Processing” is the time to first byte, or the Speed (S). Those are Speed and Latency. Those are in my screenshots, so if you don’t see then, you may need to run the test again to make sure. Sometimes ab doesn’t return the entire test results.
You can check out the Apache Bench docs for a bit more specifics.
Does that help?
-AG
-
Thanks Gunter, that really helped.
just wondering as the “processing” times are almost 0 in your case, i guess you ran ab from the same machine as the target hence the minimal processing times?
-
-
Although AB Apache test is really good, I usually try to outsource my tests and use the website loadimpact.com. They provide a reliable stress test for your website, specially if you are located in the US.
If you aren’t, the long run will matter the most, as the changes from the basal load of your website will have relevancy instead of the absolute number.


