Graphing WordPress Blog Comments Over Time

One of my other sites, CSS-Tricks, has been around a number of years now. There are nearly 1,400 unique pages of content almost all of which have a comment thread. I had a feeling that in the last four years, despite fairly steady growth in traffic and subscribers, that the number of comments per post has dropped. But how to prove it? I don’t know of a way to easily see that data.
So I built a way to visualize the number of comments per post! I’m sure all you WordPress smarties have some better fancier way to do this, but this is how I did it without too much effort or head-scratching. Here is a demo of what we’re doing in this post:
In a nutshell
Basically, you write a custom query to loop through all your posts and get the number of comments. So combining those two things, I thought I’d just make a 1px wide element with a height relative to how many comments that post has.
Step 1: Figure out the maximum number of comments
This will help us set the scale. The post with the maximum number of with have a line with 100% height, and it scales down from there. It’s easy to figure out the maximum number of comments after you looped through all the posts, but we actually need that information before we even start the loop so we can set the height during the loop.
Fortunately WordPress keeps the “comment_count” for each post in the the database. So we can write a query that will return the post with the most comments and then extract that number into a variable.
$query = "SELECT comment_count FROM " . $wpdb->posts . " WHERE post_type = 'post' && post_status = 'publish' ORDER BY comment_count DESC LIMIT 1";
$results = $wpdb->get_results($query);
$maxComments = $results[0]->comment_count;
Step 2: Loop through every single post
All posts, from the first published to the latest published.
query_posts('posts_per_page=-1&order=ASC');

while (have_posts() ) : the_post();
  // output one line of graph
endwhile;
Step 3: Output a line for the graph
Each line of the graph is going to be an anchor link, just so you can click it to go to that post should you wish. We’ll make those links inline-block, so we can set a height and width. This is the basics of the CSS:
#chart {
  padding: 100px 0;
  height: 400px;
  text-align: center;
}
#chart > a {
  width: 1px;
  background: red;
  vertical-align: bottom;
  text-decoration: none;
}
#chart > a:hover {
  background: black;
}
Now within the loop, we’ll output those links (lines of the graph):
$numComments = get_comments_number();
$heightPercentage = (($numComments / $maxComments) * 100);

echo "<a href='";
echo get_permalink();
echo "' style='height: $heightPercentage%;'>";
echo "<span>$numComments</span>";
echo "</a>";
Step 4: A little more…
There are a couple more parts to this, like listing out the first and last year at the start and end of the chart (for context) and positioning the span with the number of comments at the top of the graph so you can view numbers on rollover.
I’m going to embed the code as a GitHub Gist here, so it’s easy to keep updated once all you smarties tell me all the stuff I’m doing wrong. This is built as a page template (note: get the latest version of this code @ GitHub):
<?php /* Template Name: Comment Graph */ ?>
<!DOCTYPE html>
<html>
	<head>
		<meta charset=utf-8>
		<title>Comment Graph</title>
		<style>
			#chart { margin: 0 auto; padding: 100px 0; height: 400px; position: relative; text-align: center; }
			#chart > a {
				width: 1px;
				/* Fallback color */
				background: orange;
				/* Way cooler gradient */
				background: -webkit-linear-gradient(top, hsl(27, 95%, 45%), hsl(27, 95%, 65%), hsl(27, 95%, 45%));
				background: -moz-linear-gradient(top, hsl(27, 95%, 45%), hsl(27, 95%, 65%), hsl(27, 95%, 45%));
				background: -ms-linear-gradient(top, hsl(27, 95%, 45%), hsl(27, 95%, 65%), hsl(27, 95%, 45%));
				background: -o-linear-gradient(top, hsl(27, 95%, 45%), hsl(27, 95%, 65%), hsl(27, 95%, 45%));
				background: linear-gradient(top, hsl(27, 95%, 45%), hsl(27, 95%, 65%), hsl(27, 95%, 45%));
				display: inline-block;
				vertical-align: bottom;
				text-decoration: none;
				}
			#chart > a:hover { background: black; }
			#chart span {
				width: 50px; background: black; color: white; text-align: center;
				padding: 10px; position: absolute; top: 0; left: 50%; margin-left: -30px; opacity: 0; z-index: 1;
				}
			#chart > a:hover > span { opacity: 1; }
			#chart strong { padding: 10px; }
		</style>
	</head>
	<body>
		<?php $i = 1;
		$query = "SELECT comment_count FROM " . $wpdb->posts . " WHERE post_type = 'post' && post_status = 'publish' ORDER BY comment_count DESC LIMIT 1";
		$results = $wpdb->get_results($query);
		$maxComments = $results[0]->comment_count;
		query_posts('posts_per_page=-1&order=ASC'); ?>
		<div id="chart">
			<?php while (have_posts() ) : the_post();
				// Echo the first year post published
				if ($i == 1) {
					echo "<strong>";
					the_date("Y");
					echo "</strong>";
					// prevent from outputting next iteration
					$i = 0;
				}
				$numComments = get_comments_number();
				$heightPercentage = (($numComments / $maxComments) * 100);
				echo "<a href='";
				echo get_permalink();
				echo "' style='height: $heightPercentage%;'><span>$numComments</span></a>";
			endwhile;
			// Echo the last year post published
			echo "<strong>";
			the_date("Y");
			echo "</strong>"; ?>
		</div>
	</body>
</html>
The Graphs!
Here’s the Google Analytics chart of CSS-Tricks since launch:
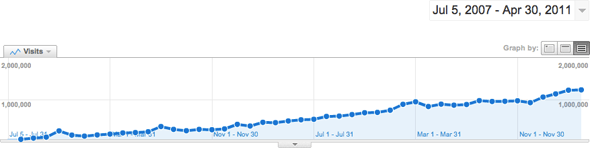
And here’s the comment graph we just built:
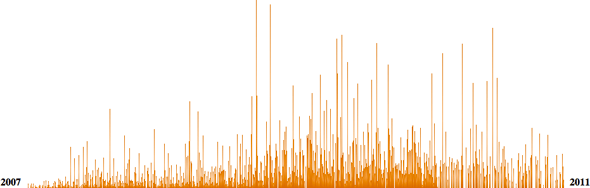
Kinda interesting. The charts definitely don’t follow each other like I would think they might. This isn’t enough data to infer why that is. You could say social media sites like Twitter have swallowed up some of comment activity. You could also say maybe the quality of the posts have gone down and inspire less comments. Who knows.
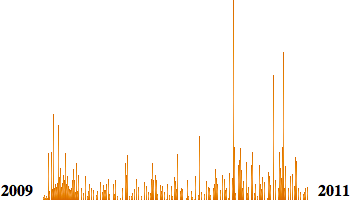
Here is Digging Into WordPress’s graph:
Share! Share!
I’d love it, especially if you have a blog that’s been around a year or more, if you snagged this page template and linked up your own graph (or screenshot it) and posted it in the comments.
Maybe with a bunch of blogs graphs we could identify some trends.
About the author
Chris Coyier is a real-world web designer who has been reaching for WordPress to power client sites for many years. He subscribes to the theory that not only is WordPress capable of powering any website it is almost always the right choice. His other projects include CodePen and Quotes on Design.
15 responses
-
 Brent Logan
Very interesting. Here’s my comment graph.
It looks like I had more engagement when my blog was “new” and then it dropped off. It’s started to increase again more recently, driven largely by having more people who know me discover my posts via Facebook. After all, those are likely the people who be most interested in my blog. The engagement is much higher on Facebook (and it’s not shown in the graph).
Editor’s note: 404 link removed.
-
Very interesting! I also set up a comment-graph demo at Perishable Press.
Not much data yet for the new posts, but the old site overall shows a favorable trend. I’ve actually been thinking about turning off comments, but I think they’re still valuable at this point. It does seem like there are fewer good comments these days though.
-
 ovidiu
hm, I have been using this plugin for years, still works (mostly).
maybe someone could pick up development :-)
-
 rgregory
I know I used to comment on CSS tricks when you’re posts were about more basic subjects, now the content is so complicated and pie-in-the-sky for me that I don’t read many posts past the title.
As your skills have grown, so has the base level of your posts. Most developers aren’t on the cutting edge, as we have to design for the general public with outdated browsers. Tricks with CSS3 and HTML5 are just theory to me. Perhaps returning to a little more basic subject matter will bring a more interactive audience back.
I wonder how many new subscribers are trolling the old content vs. reading and commenting on the newer stuff?
-
 Chris Coyier Post Author
That’s some excellent feedback, thank you! I wish more people were as honest as that.
I can understand your perspective. Over the years the posts definitely have touched on more advanced subjects as I become a more advanced front end developer. I think about that and I specifically try to still write about basic concepts / fundamental stuff. Not specifically for audience appeal, but because I like to and feel that’s vitally important stuff.
Here’s two articles in the last few weeks that are pretty fundamental stuff.
I also try and make beginner material easy to find by categorizing.
But of course yes, I do write about a lot of HTML5/CSS3/Modern JavaScript stuff. I do that because that’s what I do these days, and that’s where I feel the industry is headed. Most importantly, I get a kick out of that stuff and I need to use that fuel to keep things interesting for me.
Finally, to the point of “Most developers aren’t on the cutting edge, as we have to design for the general public with outdated browsers.” I ALWAYS think about that stuff. At Wufoo we support back to IE 6 on nearly everything and are just starting to think about coming up to IE 7 on just some parts of the app. When I do fancy HTML5/CSS3/Modern JavaScript stuff, I always think about what we can do in older browsers to make things work. Usually, I talk about that in the articles. And if I don’t, call me out!
-
rgregory
Thanks for taking the comment in the spirit it was intended. I do enjoy the site and because of your screencasts, I know what I know now. You were exploring WP as I started messing with it, and might be single-highhandedly responsible for me now teaching web design (at a Junior College, but still). So I appreciate your blogs and am most likely your biggest fan.
Keep up the good work!
-
-
-
Nice post!
As rgregory pointed out, the decline of comments per post could be related to the actual post, but can also be explained by changes in the website’s policy on commenting guidelines / handling spam /closing comments after x days / etc.
Just to nitpick, to get the most commented post, use
SELECT MAX(comment_count) FROM " . $wpdb->posts . " WHERE post_type = 'post' && post_status = 'publish' -
 Paul B. Taubman, II
Great and interesting post – I just found you after linking from a link from a link from a link… Typical web surfing stuff. Anyway, I just purchased Digging Into WP v3.1 and wanted to check you out.
Bottom line – I bookmarked your site and (as Arnold says), “I’ll be back!”
Last thing – I really like how you have the beginner content as well as the ‘funky new stuff’ – it is a great way to learn!
I am off to read my new book!
Be Well.
Paul. -
 Hassan
Neat idea! Very clever!
Just one thing, 1px is to thin! We could use percentages for the benefit of wide monitors. -
 Frag1 John
On a related note, this is a scheduled update for the Remarks plugin, which shows breakdowns of non-spam comments by Post Category and Post Author.
-
 Lucian Apostol
Great css script, but I think it is too much work and there is not enough info on the graph, you can’t figure out exact numbers
-
Chris Coyier Post Author
It’s a single file you copy and paste and then publish a page with that template. Maybe not as user friendly as a plugin but for someone with any experience at all with self hosted WordPress I’d say it’s pretty easy.
To see the exact numbers, roll over a line, there is a popup with the number value.
-
-
rgregory
Where is the file to copy and paste? I must have looked through the post 10 times and I can’t find it, most likely right in front of my face.
-
Chris Coyier Post Author
Perhaps you have JavaScript turned off?
It’s here.
-
 Chacidy
Alright alghrit alright that’s exactly what I needed!
-